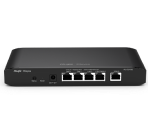
How to Retrieve WAN Health (Normal/Abnormal) via API or SNMP?
|
Hello I am integrating my EG105G-P-V3 with Prometheus and Grafana for network monitoring. SNMP exposes interface counters and operational status, but it does not expose the WAN health information shown in the router's Web UI. Specifically, I am looking for an API or local endpoint that provides the information shown on the [strong]Network Detection / Probe[/strong] page. I would like to retrieve metrics such as:
If these values are available internally through the Web UI, could you please provide the corresponding API endpoint or documentation? |
|
Thank you for your inquiry, sir. Regarding the configuration information of all Ruijie APIs, you can refer to the following document. The table of contents lists all currently supported API interface configuration functions. If not mentioned, they are currently not supported: Ruijie Cloud Document Center 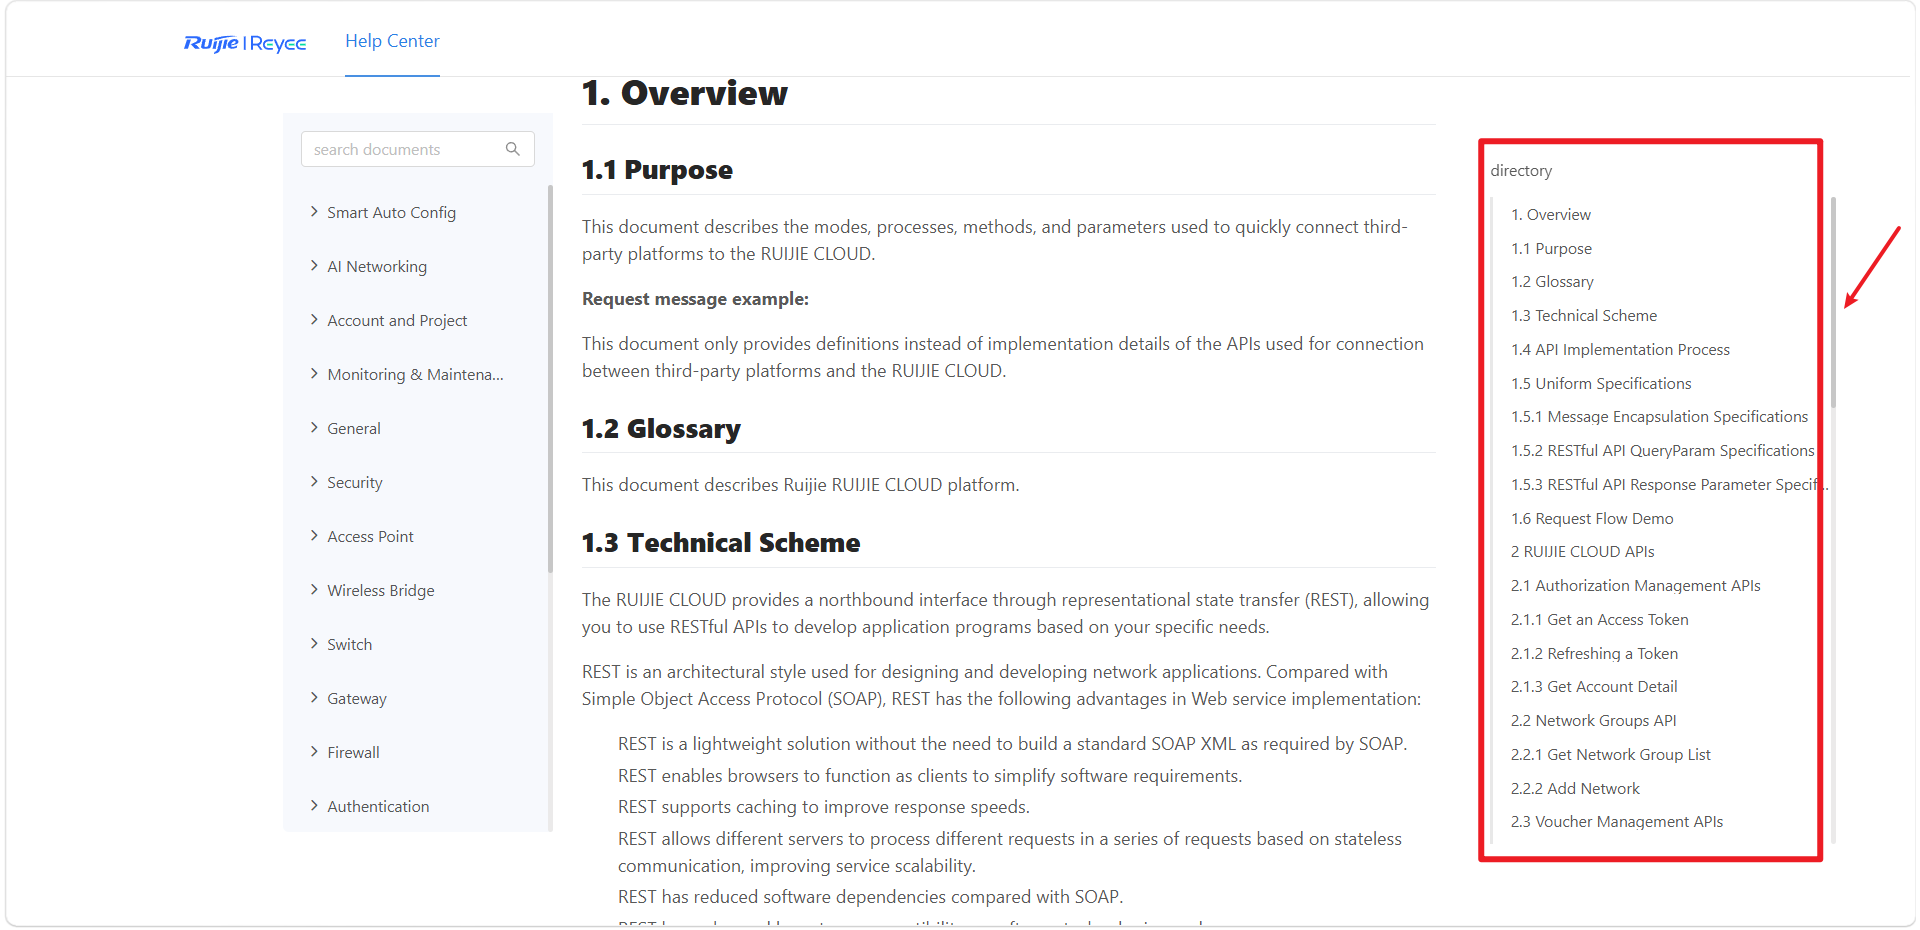 |
GTAC-Eric replied at 2026-7-9 16:46 But we can't identify how we can get the login/auth. |
This site contains user submitted content, comments and opinions and is for informational purposes only. Ruijie may provide or recommend responses as a possible solution based on the information provided; every potential issue may involve several factors not detailed in the conversations captured in an electronic forum and Ruijie can therefore provide no guarantee as to the efficacy of any proposed solutions on the community forums. Ruijie disclaims any and all liability for the acts, omissions and conduct of any third parties in connection with or related to your use of the site. All postings and use of the content on this site are subject to the Ruijie Community Terms of Use.
More ways to get help: Visit Support Videos, call us via Service Hotline, Facebook or Live Chat.
©2000-2023 Ruijie Networks Co,Ltd


 Level 1